
International Comparison of Economic Development
Here is an excerpt from Economic Lessons from 70 Years of China's Development.
As the world's second largest economic power by GDP, China's economy exhibits a fluctuating growth trend. Between the founding of the People's Republic of China in 1949 and the eve of the Reform and Opening-up, China's economic development was rather slow or even retrogressed. In 1962, China's per capita GDP dropped to the level just before the founding of the People’s Republic of China. Although Chinese economy improved after 1962, from 1966 onwards, China lagged farther behind other countries in the world by economic development. After the Reform and Opening-up, China continued to catch up on economic development and is now the world's second largest economy. This section selects four economic variables including GDP, GDP growth, per capita GDP and per capita GDP growth and compares China with Four Asian Tigers, Japan, Brazil, India and Indonesia in terms of economic development.
(1) GDP
From the founding of the People's Republic of China to 1978, since its economy was at a nascent stage, China's GDP did not grow considerably as compared with the level upon the founding of the People's Republic of China. Since the Reform and Opening-up in 1978, China has gradually become the world's second largest economic power by GDP thanks to its fast-growing GDP and significantly enhanced comprehensive national strength. For Japan and Four Asian Tigers, within 1950-2014, their GDP figures always grew at medium-to-high rates. Although their growth has been slowing down since 1980s, they remain the richest countries and regions in Asia. Among others, Japan's GDP exceeded China for the first time in 1967 and was overtaken by China in 1996. For India and Indonesia as two populous countries, their GDP also experienced a shift from slow growth to medium-to-high growth and finally grew substantially. For Brazil as a South American country, although it enjoyed a high per capita GDP around 1950, its economy has grown slowly in most recent 30 years and fallen into the middle income trap. And the gap between Brazil and China by total GDP has been widening.
Exhibit 7 Comparison among China and other regions in the world by GDP from 1950—2014 (2011 US dollar, logarithmic scale)
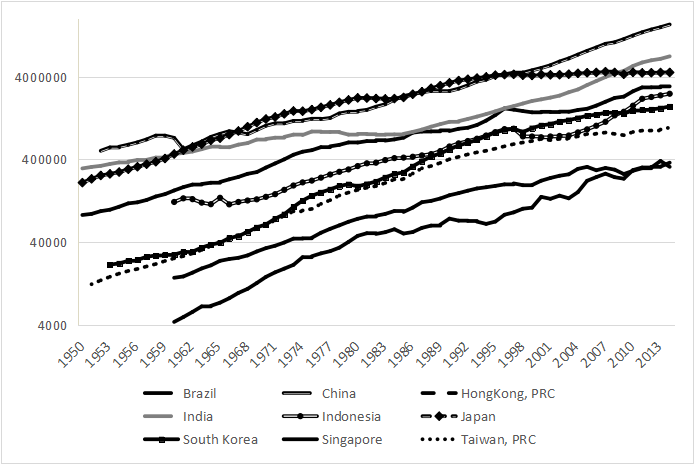
Data source: PWT database, ACCEPT calculation
(1) GDP growth
In 1949-1978, China's GDP growth was slow, just above that of India and Indonesia as two other emerging economies. From 1962 to the eve of the Reform and Opening-up, China's population grew rapidly and its GDP grew at a medium-to-high rate. After the Reform and Opening-up, with its fast-growing GDP, China became the world's fastest-growing economy and a major driver of the world's economic growth and development. Despite their high-speed GDP growth in 1950-1980, Four Asian Tigers' economic growth has slowed down since 1980s. Since Japanese economy encountered the bubble crisis in early 1990s, Japan's GDP growth has slowed down substantially and never returned to its historical peak level. For populous Asian countries India and Indonesia, after their GDP growth at a medium rate in 1950-1980, their economic growth has accelerated since 1980s and are now among the world's fast-growing economies. The GDP of Brazil, a South American country, used to grow at a medium rate for many years. However, its growth has slowed down in most recent 30 years, pointing to lack of economic development momentum.
Exhibit 8 Comparison among China and other regions in the world by GDP growth, 1950—2014
Average annual growth rate of GDP | After founding of the People's Republic of China -2014 | After founding of the People's Republic of China -1978 | 1978 -2014 |
China | 8.41% | 6.68% | 9.81% |
Brazil | 5.75% | 7.22% | 4.62% |
Hong Kong, PRC | 5.88% | 8.44% | 4.63% |
India | 4.99% | 3.65% | 6.05% |
Indonesia | 5.73% | 4.77% | 6.22% |
Japan | 4.91% | 8.31% | 2.34% |
South Korea | 7.48% | 9.15% | 6.34% |
Singapore | 8.55% | 12.16% | 6.79% |
Taiwan, PRC | 7.16% | 9.58% | 5.39% |
Data source: PWT database, National Bureau of Statistics, ACCEPT calculation
Note: Please note that the average growth rate of China is calculated by averaging annual growth rates for each year during 1978-2014 and the data is from the National Bureau of Statistics. The annual growth rate before 1978 is calculated using the data from “China Compendium of Statistics 1949-2008”. All other data is from the PWT Database.
(2) Per capita GDP
If denominated in US dollar of 2011, China's per capita GDP shortly after the founding of the People's Republic of China (i.e., 1952) was USD900 or so. By 1958, China's per capita GDP reached USD1,220. In 1958-1962, China's per capita GDP dropped to USD920 in 1962, equivalent to the level in early years after the founding of the People's Republic of China and slightly below that of India and Indonesia in the same period. In 1962-1978, China's economic development was relatively stagnant and per capita GDP of China and India generally ranged between USD1,100 and USD1,300 and grew slowly. In contrast, for Four Asian Tigers in the same period grew rapidly. By 1978, South Korea's per capita GDP was 3.5 times that of China, Taiwan's figure was 5.5 times that of China, and the figures of both Singapore and Hong Kong were 9 times that of China. Japan developed more quickly and its per capita GDP was up to 11 times that of China. Although Brazil as a South American country grew slowly, its per capita GDP was 3.5 times that of China.
After the Reform and Opening-up, China's per capita GDP grew rapidly from USD1,516 in 1978 to USD12,513 in 2014, pointing to nearly tenfold growth. Compared with other countries, from 1978 on, China's leading advantage over India gradually intensified and its per capita GDP exceeded Indonesia in 1999. With growth slowdown of Japan and Four Asian Tigers, the gap between China and those countries by per capita GDP continued to narrow. In 2014, Hong Kong's per capita GDP was less than 4 times that of China, and the figures of South Korea and Japan were merely 3 times that of China. The per capita GDP of South American country Brazil fluctuated sharply and was on a par with China's per capita GDP.
Exhibit 9 Comparison between China and other regions by per capita GDP, 1950—2014 (2011 USD, logarithmic scale)
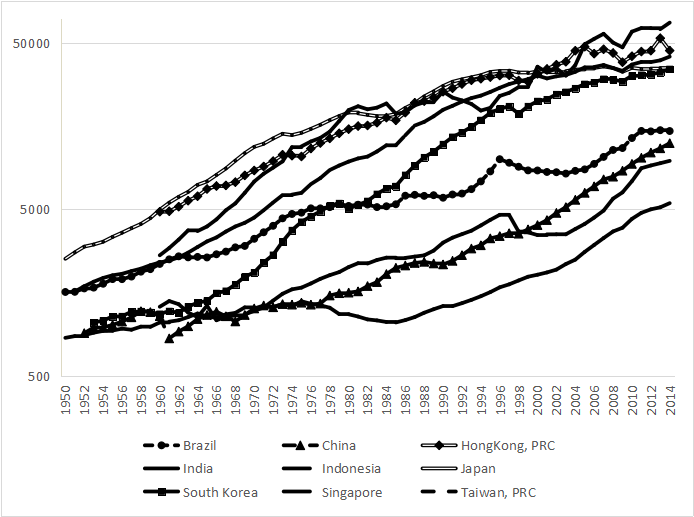
Data source: PWT database, ACCEPT calculation
(3) Per capita GDP growth
From early years after the founding of the People's Republic of China to 1978, China's population grew quickly and its per capita GDP growth was only 4.52%, only ahead the corresponding figures of India, Indonesia, and Brazil. Among Four Asian Tigers, the growth rate of Hong Kong (lowest by per capita GDP growth) was 5.81%, while the growth rate of Singapore (highest by this measure) was 9.98%. Within the same period, Japan also maintained high-speed growth and its per capita GDP grew at a rate of 7.10%.
After the Reform and Opening-up in 1978, China's economy developed fast and its population growth slowed down. Its per capita GDP growth reached a historical high of 8.73%. The growth rate of India and Indonesia as the same populous countries also improved. Economic growth of Japan, Four Asian Tigers and Brazil as a South American country was somewhat weak, and their growth rates were well below their growth rates in the previous period.
Exhibit 10 Comparison among China and other regions in the world by per capita GDP growth, 1950—2014 (2011 US Dollar)
Annual average growth rate of per capita GDP | After founding of the People's Republic of China -2014 | After founding of the People's Republic of China -1978 | 1978 -2014 |
China | 6.87% | 4.52% | 8.73% |
Brazil | 3.55% | 4.29% | 2.97% |
Hong Kong, PRC | 4.22% | 5.81% | 3.44% |
India | 2.96% | 1.50% | 4.11% |
Indonesia | 3.81% | 2.46% | 4.50% |
Japan | 4.22% | 7.10% | 2.04% |
South Korea | 5.92% | 6.68% | 5.40% |
Singapore | 6.15% | 9.98% | 4.28% |
Taiwan, PRC | 5.30% | 6.43% | 4.46% |
Data source: PWT database, National Bureau of Statistics, ACCEPT calculation
Note: Please note that the average growth rate of China is calculated by averaging annual growth rates for each year during 1953-1978 and 1978-2014, respectively. The data is from “China Compendium of Statistics 1949-2008” and the National Bureau of Statistics, respectively. All other data is from the PWT Database.